Learning together starts with a useful measurement.
Five stories about medical imaging, collaborative AI, and the people behind a shared model.
Bennett Landman · Vanderbilt University / VALIANT Adapted from my talk at GSSIC 2026 (October 23, 2026)
Structure. Context. Connection.
The five-minute overview
Five stories. One shared question.
How do we turn medical images into knowledge that is useful across people, places, and time?
Learning together starts with a useful measurement.
AI makes it possible to measure anatomy at scale. Making those measurements useful takes shared definitions, appropriate references, local evaluation, and people who can work across institutional boundaries.
01
Measure
Make the picture measurable.
A scan can answer more than the question that first brought someone to the scanner. Anatomical labels let us describe structures consistently and ask new questions of existing images. Faster methods make that practical across large collections.
Why it matters: a useful label needs a clear meaning and a reviewable error.
Bringing studies together also brings differences in scanners, protocols, populations, and reasons for imaging. Quality review and harmonization help distinguish technical effects from the biology we want to understand.
Why it matters: a larger collection can still produce a misleading comparison.
Brain structure changes with age. Reference charts place a measurement in the context of a population and a stage of life. Their meaning depends on who is represented, who is missing, and whether the new person fits that reference.
Why it matters: an unusual measurement is a reason to investigate, rather than a diagnosis by itself.
A shared model can be developed through local computation and exchanged updates while images stay at their institutions. The glioblastoma collaboration shows what a coordinated network can study; its evaluation still needs to be examined site by site.
Why it matters: a strong global result can coexist with a local failure.
The spinal cord connects the brain to much of what the body does. Studying it alongside the brain creates new opportunities, while demanding attention to resolution, motion, reproducibility, and the limits of transferred methods.
Why it matters: promising measurements need evidence for the decisions they are intended to support.
Adapted from my talk at GSSIC 2026 (October 23, 2026). The guided chapter links each research claim to its sources; the reading room provides annotated PubMed links.
The twenty-minute guided chapter
Images become measurements. People make them useful.
I tell my kids that I find things in pictures. Essentially, I am an engineer who does that. The scientific question is what we can learn when those pictures become measurements—and when the people making those measurements can learn together.
I follow that question through five stories from brain mapping to the spinal cord. The same thread runs through each one: a useful measurement needs a consistent meaning, a reference that fits the person, and evidence that survives a change of place.
“They’re not pixels. They’re samples of a human.”
That changes how we think about scale. A bigger collection is valuable when it helps answer a better question. A faster model is valuable when it makes a measurement repeatable and available. A shared model is valuable when its benefits can be examined where people receive care.
01 / Measure
Make an image useful beyond the moment it was acquired.
When I joined Vanderbilt, much of my work focused on brains. Clinical scans were already being acquired and stored. Could we use those archives to ask new questions about neuroscience, psychiatry, and development?
To compare anatomy, we first need to identify the same structures across people. A label on an image becomes a measurement when it gives us a reproducible way to describe a region’s size, shape, or tissue properties. Getting that label right is difficult because human anatomy varies.
Earlier approaches used multiple labeled examples called atlases. Each atlas was aligned to a new scan, and the candidate labels were combined. This could consume years of accumulated computing time across a large collection. The bottleneck was consequential: a method that occupied a cluster for months was hard to carry into everyday use.
From a picture to a measurement
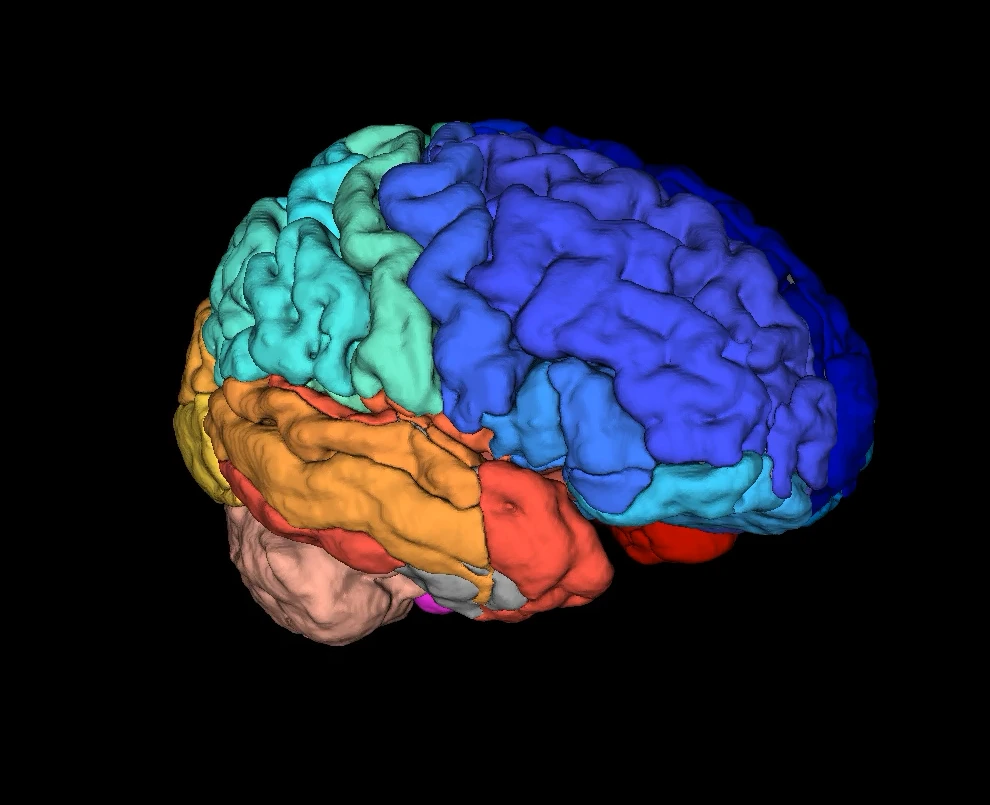
Give the same structure a consistent name.
Segmentation supplies anatomical labels. Scientific review asks whether those labels mean the same thing across scans and people.
Colors distinguish regions and do not indicate disease.
Learning-based systems changed the balance between development and use. A substantial investment in training could produce a much faster labeling step for each subsequent scan. Our SLANT work reported a reduction from more than 30 hours to about 15 minutes in its evaluated pipeline. That is a historical result for that method and setting, rather than a timing promise for every scanner, computer, or modern model. Huo Y et al., 2019 · PubMed ↗
The next question was whether the same ideas could travel beyond the brain. Shared datasets and challenges let many groups test their methods against common tasks. The Medical Segmentation Decathlon extended that comparison across organs and imaging modalities, including tasks that participants had not seen during development. Its lesson concerns methods that can be retrained successfully on new tasks; it does not mean that one fixed model understands every organ. Antonelli M et al., 2022 · PubMed ↗
First decide what an error means.
A boundary may look almost right while missing a small, important structure. The overlap score in the exploration below answers a geometric question. Whether that error matters for a clinical decision requires a different kind of judgment.
Explore 01 · The boundary matters
Same shift. Different score.
Compare one large object with six small objects. Keep the same displacement, change the small objects’ size, or leave some small objects out. Does a high pooled Dice mean every object was found?
ReferencePredictionOverlap
AlignedFarther apart
None includedAll included
—
Pooled Dice · all foreground pixels
Synthetic geometry, not patient data. Pooled Dice gives larger objects more influence. Mean object Dice weights all seven reference objects equally and scores an omitted object as zero. Detection recall is the fraction of reference objects with any positive-area overlap with their paired prediction; this deliberately permissive teaching rule is not a clinical detection standard. Predictions stay paired with their reference objects, with no cross-matching. The large object is always predicted. Detection and boundary quality answer different questions.
Validation should follow the intended use. Measuring a large organ, detecting a small lesion, and avoiding a critical surgical structure can demand different evidence. The Metrics Reloaded recommendations offer a practical starting point for that choice. Maier-Hein L et al., 2024 · PubMed ↗
Carry this question forward
What exactly is the measurement, and which failure would make it misleading?
02 / Scale
More scans bring more differences.
A measurement that works on a carefully selected dataset is a beginning. Population research brings together scans collected for different reasons, on different systems, over many years. The challenge is to make those measurements comparable without erasing the biology we hoped to study.
Consider two hospitals. One scans many younger people; the other treats an older population. They also use different acquisition protocols. If their measurements differ, age and scanner are both plausible explanations. Simply making the two distributions look alike could remove a meaningful age-related difference.
Schematic distributions, not observed data. A difference between study groups can reflect acquisition, population, or both. The illustration does not depict a harmonization result.
Harmonization is the effort to reduce unwanted technical variation while retaining relevant biological variation. Methods such as ComBat provide one route for specified imaging measurements. Their usefulness depends on the study design, the variables available, and the assumptions we can defend. They cannot supply information about a population that was never represented. Fortin JP et al., 2018 · PubMed ↗
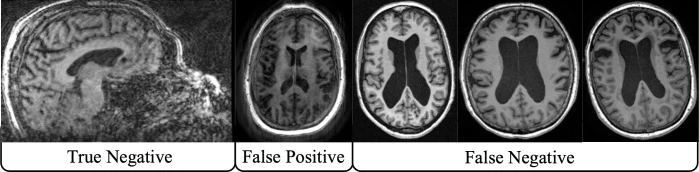
Scale also makes quality control a scientific problem. Successful completion of a processing pipeline tells us that it ran. It does not tell us that a brain mask, anatomical label, or reconstructed pathway is plausible. Motion or unusual anatomy can produce an output that needs a human look.
Quality-control examples from Kim et al., PLOS One (2025). The positive/negative labels refer to that study’s quality-control classification, not disease diagnosis. Study and figure context · PubMed ↗
Our group’s quality-control work asks how people can review large collections consistently: present the right views, make the decision quick to record, and bring judgments together across a team. This is part of the infrastructure of discovery. Reliable labels, documented exclusions, and reviewable failures make later results easier to trust.
For a spine registry, the same reasoning applies across scanners, surgeons, protocols, and indications. Before pooling a number, ask how it was acquired and why the person was scanned. A clinical archive is a record of encounters with a health system; the circumstances of those encounters help determine who appears in it.
Carry this question forward
Which differences are technical, which are biological, and which cannot be separated with the data we have?
03 / Compare
“Compared with whom?” is part of the measurement.
A height means something different at age six and age sixty. Brain measurements also change over the lifespan. A reference curve gives a measurement context: where does it sit among people of a similar age in the reference sample?
The wider brain-chart field provides an important foundation. Led by researchers at the University of Pennsylvania and the University of Cambridge, Bethlehem, Seidlitz, and colleagues assembled lifespan references for brain morphology. Our white matter work follows the brain’s communication pathways, examining their structure across age. These are related efforts, with different measurements and study populations. Bethlehem RAI et al., 2022 · PubMed ↗
The published white matter analysis processed and standardized 35,120 scans to create lifespan references. The broader processing effort should not be confused with the analysis sample in the paper. The point is the combination of consistent measurement and an age-dependent reference. Kim ME et al., 2026 · PubMed ↗
Explore 02 · Compared with whom?
A measurement needs a reference.
Keep the measurement fixed at 65 illustrative units. Change the person’s age and the ages represented in the reference.
Illustrative 10th / 50th / 90th curves
5 years90 years
—
Illustrative centile
A reference rank describes a measurement’s position among peers.
Synthetic teaching model. The curves and units are invented to explain reference coverage. Shading marks the reference’s age range; dashed curves outside it illustrate extrapolation. They are not fitted to the cited brain charts and cannot assess a scan. A centile is a rank within a reference, not a probability of disease.
The exploration makes a limitation visible. A narrow reference may support a comparison within its observed ages. Moving outside that range does not create new evidence. A curve drawn there would be an extrapolation, even if it looked smooth and precise.
Who is missing from “normal”?
Who gets to define a reference? That choice shapes the meaning of every comparison. We often have many scans from people who needed clinical attention and fewer from people who were well. An apparently normal organ in a hospital dataset may belong to someone scanned because another part of their body was unwell.
Age is only one dimension. Geography, exposures, access to care, recruitment, and health history can shape a reference sample. A large number of scans can coexist with a serious gap in coverage. Describing that gap is more informative than hiding it behind a single total.
Reference charts offer a way to study individual variation and patterns associated with disease. A low centile on its own does not diagnose a condition. The next studies must ask whether a measurement adds useful information to an actual decision, and whether that information holds up in a new setting.
Carry this question forward
Does the reference represent the person and setting in which we want to use the measurement?
04 / Federate
Bring learning together across institutional boundaries.
People are at places. Their scans, clinical histories, and annotations sit within institutions that have responsibilities to those people. A useful collaboration has to work within those responsibilities.
Federated learning offers an architecture for collaboration: institutions can train locally and exchange model updates to develop a shared model. Images can remain at their home institution. The architecture changes what crosses the boundary, while leaving substantial work in data preparation, agreements, security, and evaluation. Rieke N et al., 2020 · PubMed ↗
71institutions in the consortium
6continents represented
6,314patients across the study dataset
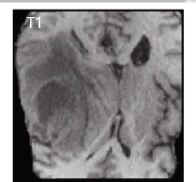
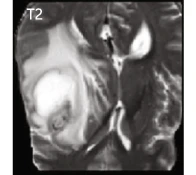
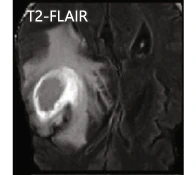
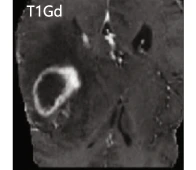
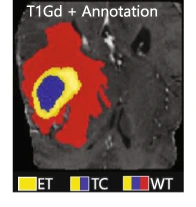
The glioblastoma collaboration, led by Penn Medicine at the University of Pennsylvania, gives this idea a concrete setting. The consortium developed a tumor-boundary detector using data from geographically distributed institutions. These counts describe the overall study; development, local holdouts, and out-of-sample evaluation served different roles. The study tested segmentation generalization, rather than whether the model improved a surgical outcome. Pati S et al., 2022 · PubMed ↗
T1T2T2-FLAIRT1 with contrastReference labels
Selected panels from Pati et al. (2022), Figure 1b. MRI contrasts emphasize different tissue characteristics. Reference labels distinguish enhancing tumor (ET), tumor core (TC), and whole tumor (WT); they are not interchangeable targets. Original study · PubMed ↗
Agree on the target before sharing the model.
Sites need to agree on the anatomy being labeled, the inputs needed to see it, and how annotations will be reviewed. A difference in labeling convention can look like a model failure. In the audience discussion, I described the local scientific lead, clinical annotation effort, and institutional review that made participation possible.
They also need to agree on whose errors receive attention. A result dominated by a large institution can obscure a smaller institution’s experience. The exploration below isolates this issue at evaluation time. It shows why a global report needs local reports beside it.
Explore 03 · The average has a point of view
Whose patients count in the headline?
Change each hospital’s relative case weight and condition prevalence. How do patient mix and the choice of weighting interact?
—
Headline condition-detection accuracy
Invented classification example, not segmentation or federated training. Sensitivity (correct detection among people with the condition) is fixed at A: 95%, B: 80%, C: 55%; specificity (correct exclusion among people without it) is A: 90%, B: 94%, C: 98%. Local accuracy = prevalence × sensitivity + (1 − prevalence) × specificity. Relative case weights are normalized to sum to 100%; they are not percentages until normalized. Equal-site weighting uses one-third per site regardless of case weight. Prevalence still changes each site’s accuracy. No model is retrained, and these numbers are not consortium findings.
Model updates also deserve protection: keeping images local is not, by itself, a privacy guarantee. Security and privacy measures need to match what is shared, who can inspect it, and what threats the collaboration is designed to address. Likewise, someone must be able to audit a run, investigate a local failure, or pause the system. These are choices about stewardship as well as computation. Federation considerations · PubMed ↗
Carry this question forward
Do the partners share a target, an evaluation plan, and a working agreement about who maintains the result?
05 / The next frontier
Follow the question beyond the brain.
The brain and spinal cord form a connected system, yet their imaging problems differ. The cord is small, moves within a challenging environment, and is vulnerable to the effects of limited resolution and processing choices. A method that works well in the brain needs fresh scrutiny in the cord.
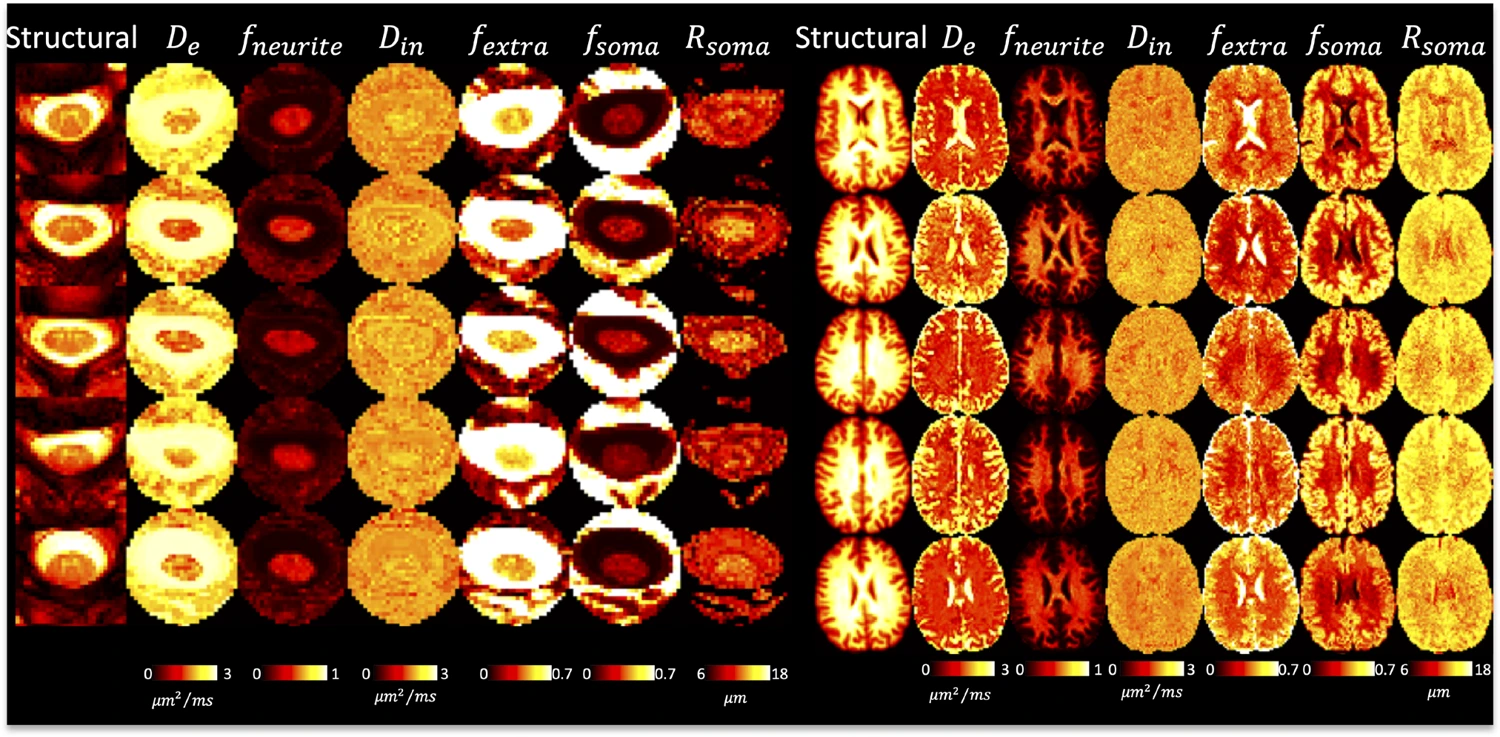
Research maps: see Schilling et al., Imaging Neuroscience (2025), for the brain-and-cord protocol and interpretation of its model-derived measures. Schilling KG et al., 2025 · PubMed ↗
The brain-and-cord diffusion work illustrates both opportunity and limitation. Tissue-sensitive models can be studied across the neuroaxis, but reproducibility and contrast were weaker in the cord. That finding helps define the engineering work still needed before a promising measurement can carry a stronger interpretation. Schilling KG et al., 2025 · PubMed ↗
Our spinal cord roadmap also includes ongoing work identified as accepted or under revision. They should not inherit the evidentiary status of a completed clinical evaluation merely because they appear beside published results.
Three study stages, three different questions.
01 / Frozen-model evaluation
Does it travel?
Keep the model fixed. Test it on untouched local data, including the difficult cases. Look for the failures hidden by the average.
02 / Training comparison
Does sharing help?
Compare local and shared learning under a defined design. Account for data, labels, and evaluation so the difference is interpretable.
03 / Silent prospective evaluation
Does it fit practice?
Observe the system on incoming cases without directing care. Assess reliability and workflow before a study of clinical impact.
Each stage supports a different claim. A successful retrospective comparison can motivate prospective evaluation. A silent study can reveal operational problems. Demonstrating a benefit to care requires evaluation of the decision or outcome the tool is intended to change. Kelly CJ et al., 2019 · PubMed ↗
For spine care, this creates a productive agenda: choose useful measurements, define them consistently, learn across institutions with complementary experience, and examine the result locally. The specific anatomy changes. The need for a defensible measurement remains.
“Learning together starts with a useful measurement.”
The invitation is to start with a shared question. What do we need to measure? Whose experience is missing? What would convince us that the answer helps? Those questions give collaborative AI a purpose that the architecture alone cannot supply.
The reading room · A technical dive through the literature
Follow the evidence.
Eleven selected papers, with a reason to read each one and a limit to keep in mind. Begin with the story that caught your attention.
11 papers
01
Measure
3D whole brain segmentation using spatially localized atlas network tiles
Huo Y, Xu Z, Xiong Y, et al. · NeuroImage · 2019
The measurement story: anatomically localized networks make detailed brain labeling practical. The reported pipeline reduced processing from more than 30 hours to about 15 minutes.
Keep in mind: A research segmentation benchmark; speed and anatomical agreement do not establish improved patient outcomes.
Antonelli M, Reinke A, Bakas S, et al. · Nature Communications · 2022
Why shared challenges matter: ten segmentation tasks tested how methods transfer across problems. Read for the distinction between a broadly useful training method and a model used unchanged on a new task.
Keep in mind: Generalization here includes retraining on new tasks. Benchmark success is not evidence of routine clinical adoption.
Harmonization of cortical thickness measurements across scanners and sites
Fortin JP, Cullen N, Sheline YI, et al. · NeuroImage · 2018
A useful entry into scanner effects and ComBat. It explains why combining measurements requires attention to technical variation as well as the biological question.
Keep in mind: The method and evidence concern specified measurements and study designs. Harmonization does not automatically remove every source of bias.
Scalable quality control on processing of large diffusion-weighted and structural magnetic resonance imaging datasets
Kim ME, Gao C, Newlin NR, et al. · PLOS One · 2025
The people behind reliable scale: a team-based visual review workflow for processing outputs. Read for practical ways to make quality control consistent and manageable.
Keep in mind: Automated outlier detection and visual review answer overlapping questions; neither should be treated as a universal certificate of quality.
Bethlehem RAI, Seidlitz J, White SR, et al. · Nature · 2022
The growth-chart analogy made concrete: lifespan reference curves place brain morphology in an age-related context. This is foundational work by another consortium that helps frame the white matter work.
Keep in mind: A centile describes position within a reference. It does not, by itself, provide a diagnosis or a probability of disease.
White matter micro- and macrostructure brain charts for the human lifespan
Kim ME, Gao C, Ramadass K, et al. · Nature · 2026
The brain’s wiring across the lifespan: the published analysis standardized 35,120 scans to construct lifespan references for white matter pathways, with open charts and software.
Keep in mind: Broader processing totals are different from the published analysis sample. Research references still require evaluation for a particular clinical use.
The future of digital health with federated learning
Rieke N, Hancox J, Li W, et al. · npj Digital Medicine · 2020
Start here for federation: what can be shared, what remains local, and why institutional agreements, data differences, privacy, and operations shape the system.
Keep in mind: A perspective and overview, rather than evidence that any one federated system improves care or guarantees privacy.
Federated learning enables big data for rare cancer boundary detection
Pati S, Baid U, Edwards B, et al. · Nature Communications · 2022
The central case study: glioblastoma boundary detection using data from 71 institutions across six continents, covering 6,314 patients. Read for the study’s staged design and evaluation at participating and unseen institutions.
Keep in mind: These are consortium-wide counts, not a single training split. Boundary-detection results do not establish improved surgical decisions or patient outcomes.
Metrics reloaded: recommendations for image analysis validation
Maier-Hein L, Reinke A, Godau P, et al. · Nature Methods · 2024
A guide to choosing an evaluation that matches the question. Read when a single attractive score is being asked to represent small structures, rare findings, and very different clinical consequences.
Keep in mind: Recommendations for validation design, not a universal leaderboard or proof of clinical utility.
Characterization of neurite and soma organization in the brain and spinal cord with diffusion MRI
Schilling KG, et al. · Imaging Neuroscience · 2025
A bridge from brain to cord: diffusion MRI models characterize both regions in one protocol. Read for the feasibility and reproducibility questions that accompany a new measurement.
Keep in mind: The cord showed weaker reproducibility and tissue contrast than the brain. These are model-derived tissue-sensitive measures, rather than direct counts of cells.
No papers match this search. Try a different term or choose “All.”
About the sources, illustrations, and adaptations
This is a first-person teaching essay about medical imaging and collaborative AI. Scientific claims link to original studies; explanatory diagrams and interactive examples are identified separately from research findings.
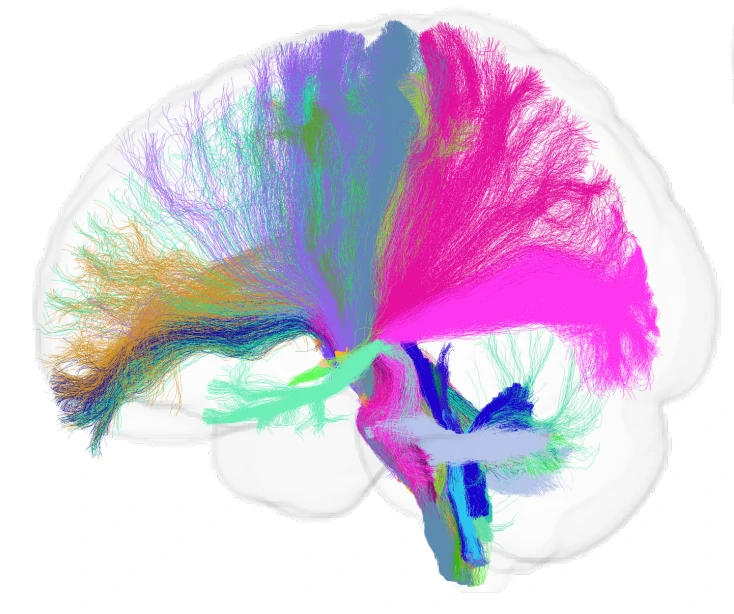
Scientific image credits: quality-control examples, Kim et al., PLOS One (2025); glioma MRI panels, Pati et al. (2022), Figure 1b; brain-and-cord diffusion maps, Schilling et al., Imaging Neuroscience (2025). Linked studies provide figure context and interpretation. The brain-surface and tractography images illustrate anatomy without making claims about ongoing research results. Copyright remains with the respective creators. Images were resized for the web; the brain surface was cropped around the anatomy.
The network, schematic study distributions, and reference-curve drawings are original explanatory diagrams. All three explorations use invented geometry or synthetic values; none reproduces patient data, trains a medical model, or estimates an individual’s clinical status.
Published analysis counts are kept separate from broader processing efforts. Ongoing spinal cord work is identified as ongoing. Findings about segmentation, reference curves, or feasibility are not presented as proof of improved patient outcomes.
Reading-room records and annotations were checked against PubMed and publisher records on October 23, 2026. The 2026 white matter paper’s publisher correction is linked alongside its citation. This is a focused reading selection rather than a systematic review.
The visual palette draws on Vanderbilt’s published color guidance: cream, black, white, flat gold, and supporting neutral colors. This is Bennett Landman’s visual essay library.
The people behind the work
Science is a Team Sport
These people—and many others—made the work possible. I am honored to have the privilege to learn from and work with amazing teams.
A book made of names864 people · 22 collective credits
Inspect the artwork
Every name belongs here.
Move over the pages to magnify. Tap or click to hold the lens. You can also find a name or use the arrows to explore alphabetically.
I gratefully acknowledge my collaborators, the authors whose studies informed this essay, and the people recognized in the keynote.
Read the alphabetical roster (864 people)
Alphabetical by surname. Each name links to a source study or acknowledgment.
This artwork includes every author in the complete indexed bylines of the eleven reading-room papers, additional identifiable studies explicitly cited in the keynote, the public preprint corresponding to its ongoing brainstem work, and confirmed people named in the talk and slide acknowledgments. It recognizes both direct collaborations and work by other teams that helped shape the ideas here.
Names are retained as recorded by PubMed, PMC, publishers, or the original authors. Clear variants of the same name are combined; named consortium authors are preserved separately. Collective credits are not expanded into membership or investigator lists. Names that could not be reliably identified from the transcript are omitted. Metadata was checked on October 23, 2026.